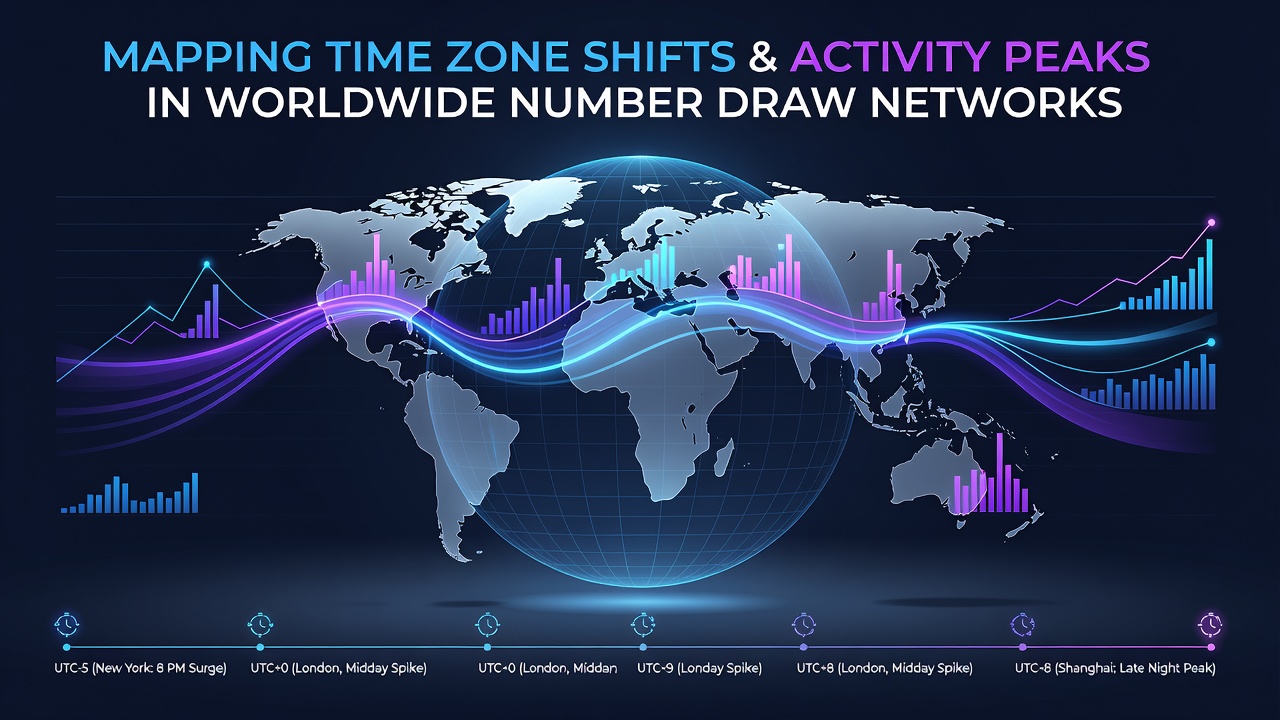
Mapping Time Zone Shifts and Their Influence on Activity Peaks in Worldwide Number Draw Networks
Number draw networks operate across continents where coordinated lotteries and random selection systems connect participants from dozens of time zones at once. These networks schedule draws at fixed universal times yet participant engagement follows local clocks, which creates measurable shifts in activity peaks as the globe rotates through daylight and evening hours.
Core Mechanics of Global Draw Timing
Operators set draw moments in coordinated universal time while platforms convert those moments into local displays for each user. A draw scheduled at 20:00 UTC lands at 3:00 p.m. in New York, 8:00 p.m. in London, and 5:00 a.m. the next day in Tokyo. Data collected from major networks shows that the same numerical draw can therefore trigger three distinct engagement waves separated by several hours.
Researchers tracking participation logs note that peaks cluster three to four hours before each local draw time. In regions where the draw falls during standard working hours, pre-draw traffic rises modestly during lunch breaks and again after 5:00 p.m. When the draw lands in early morning hours, activity instead concentrates the previous evening.
Seasonal Adjustments and Daylight Saving Effects
Twice each year, portions of the northern and southern hemispheres shift their clocks by one hour. Network operators must adjust displayed times and sometimes alter backend scheduling windows to keep the actual draw instant constant. In June 2026, several European and North American jurisdictions will have already moved to summer time, while Australia and New Zealand will be approaching their winter time reset. These staggered changes produce temporary mismatches where a draw that normally peaks at 7:00 p.m. local time suddenly occurs at 8:00 p.m. for users who have not yet updated their device settings.
Traffic analytics from cross-border platforms reveal that these one-hour offsets shift peak volume by roughly 12 to 18 percent into the newly aligned hour. Systems that automatically detect user time-zone settings reduce the disruption, whereas platforms relying on manual updates see prolonged lag before activity stabilizes.
Regional Patterns Across Major Networks
North American draws such as those administered through multi-state compacts consistently record highest traffic between 7:00 p.m. and 9:00 p.m. Eastern Time. European networks show a primary spike between 7:00 p.m. and 10:00 p.m. Central European Time, with a secondary morning surge in Nordic countries where draws occur before work hours. Asia-Pacific networks register their strongest activity between 8:00 p.m. and 11:00 p.m. local time, though Australian users demonstrate an additional early-afternoon cluster when European draws fall during their evening.
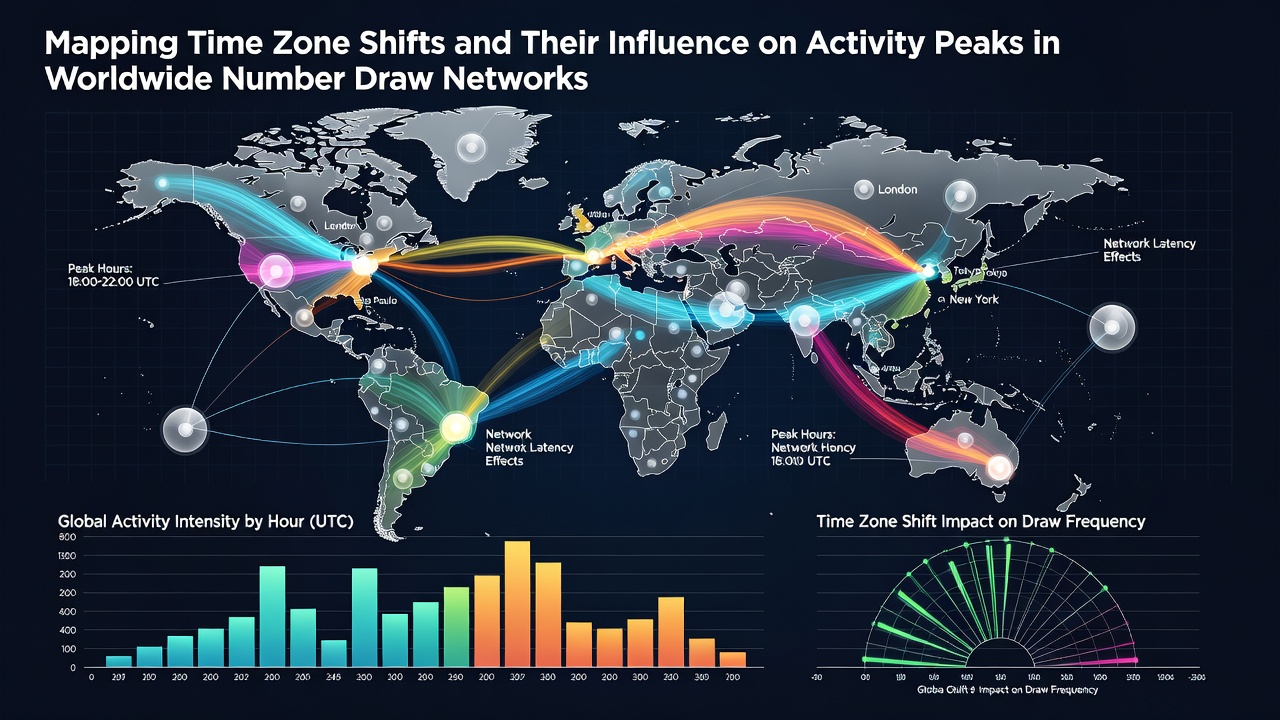
One study released by the Asia Pacific Lottery Association documented that simultaneous global draws generate overlapping peaks when the time difference between two major markets equals four hours or less. In those windows, total concurrent users rise above the sum of individual regional peaks because participants from both zones remain active during the shared period.
Data Sources and Measurement Methods
Network administrators compile timestamped transaction logs that record each ticket purchase against the purchaser's declared time zone. Aggregated datasets released by regulatory bodies in Canada and Australia allow external analysts to map volume against UTC offsets without exposing individual records. University research groups in Singapore have cross-referenced these logs with publicly available sunrise and sunset tables to isolate whether daylight itself influences participation beyond the draw clock.
Figures released by the European Lotteries association indicate that the introduction of real-time countdown timers synchronized to each user's local zone increased pre-draw purchases by 9 percent across tested markets during the 2025 calendar year. The same report notes that mobile applications using automatic time-zone detection maintained steadier traffic curves than desktop sites that required manual refresh.
Implications for Network Infrastructure
Server load balancers must accommodate three or four distinct traffic waves within any twenty-four-hour period. Capacity planning models therefore incorporate time-zone heat maps rather than single daily peaks. Operators that align promotional pushes with the leading edge of each regional wave report more efficient use of bandwidth and reduced queue times at draw cutoff.
Those who have studied longitudinal data observe that networks covering more than eight time zones experience at least one period each day when two major markets generate simultaneous demand. In June 2026, the overlap between North American evening and East Asian morning draws will occur between 01:00 and 03:00 UTC, creating a predictable infrastructure stress point that administrators schedule maintenance windows around.
Conclusion
Time zone mapping provides network operators with a predictive framework for anticipating when activity will rise and fall across worldwide number draw systems. By aligning scheduling, promotion timing, and server resources to these shifting patterns, administrators maintain consistent service levels despite the constant rotation of local clocks. Continued collection of timestamped participation data will allow further refinement of these models as additional markets join existing networks.